I put two SATA SSDs on a desktop and measured how much RAID actually changes real disk performance. Same drives, same box, three configurations: Non-RAID, RAID 0 (stripe), and RAID 1 (mirror). Everything was driven by Microsoft DiskSpd (v2.2) through a single PowerShell script so the numbers are comparable across runs. This post walks through the hardware, the BIOS/RAID setup, the disk formatting on Windows 11, the exact code I ran, and the results.
In short, each mode buys you something different: RAID 0 chases speed and capacity — striping across both drives for close to double the throughput and the combined size of the two disks. RAID 1 chases safety and uptime — mirroring every write so the array keeps running through a single-drive failure, with a read boost as a bonus. The benchmarks below show exactly how much of each advantage actually shows up in practice.
RAID levels this board supports. On the ASUS TUF Gaming B760-Plus WiFi D4, SATA RAID is handled by Intel Rapid Storage Technology (RST), which supports RAID 0, 1, 5 and 10 across the board's four SATA 6 Gb/s ports. (RAID 6 is not available on Intel's consumer RST — it belongs to Intel's enterprise VROC/RSTe platforms.)
Why only RAID 0 and RAID 1 here. I only had two SSDs on hand, and two drives is exactly the minimum for RAID 0 and RAID 1 — RAID 5 needs at least three and RAID 10 needs four. So this post tests just those two levels. That's not much of a limitation for understanding RAID, though: RAID 0 and RAID 1 are the two fundamental ideas — stripe for speed vs. mirror for safety — and the higher levels (5, 10) are essentially combinations of these same two behaviors. Seeing how 0 and 1 behave gives you the mental model for all of them.
Want the full picture? For a thorough, vendor-neutral rundown of every RAID level (including 5, 6 and 10) and the math behind them, see Wikipedia's Standard RAID levels, and Intel's own Rapid Storage Technology support page.
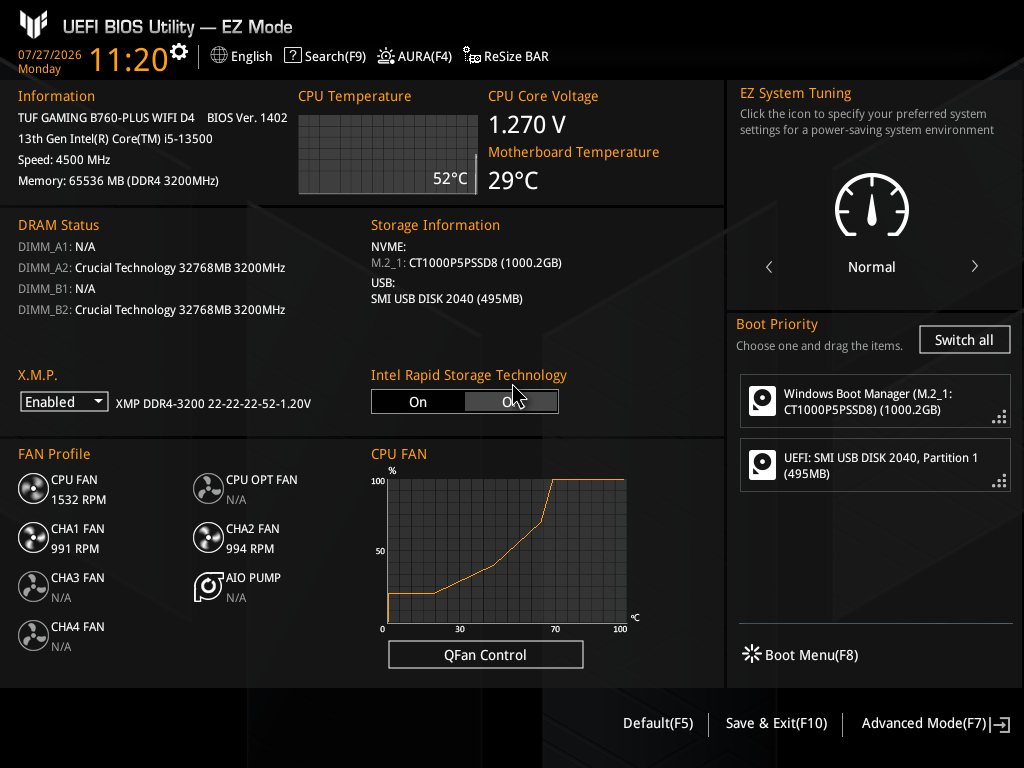
The test bench is an ASUS TUF Gaming B760-Plus WiFi D4 board with a 13th Gen
Intel Core i5-13500 and 64 GB of DDR4-3200 (XMP enabled). Storage under test: two
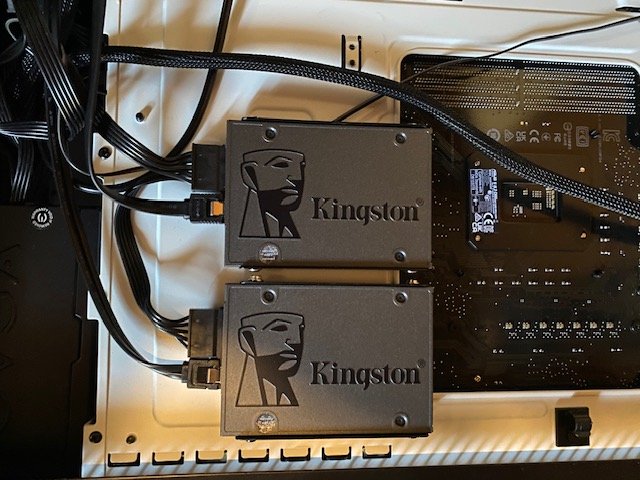
Kingston A400 480 GB SATA SSDs (reported as KINGSTON SA400S37480G,
447.1 GB usable each), both connected over the motherboard's SATA ports.
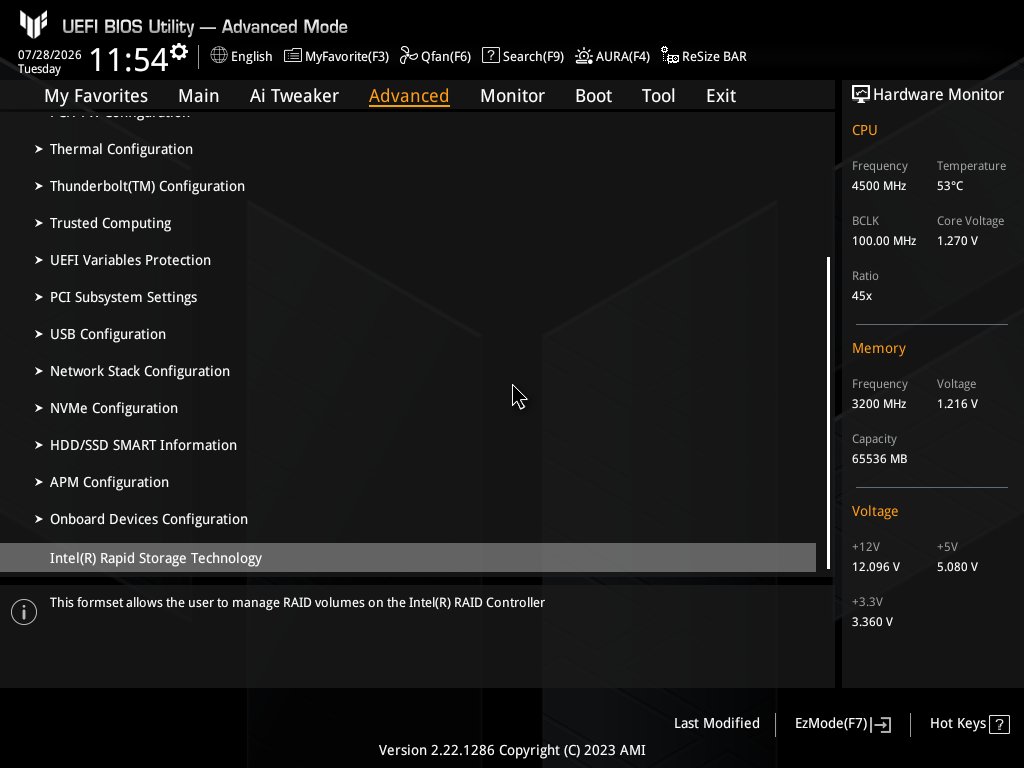
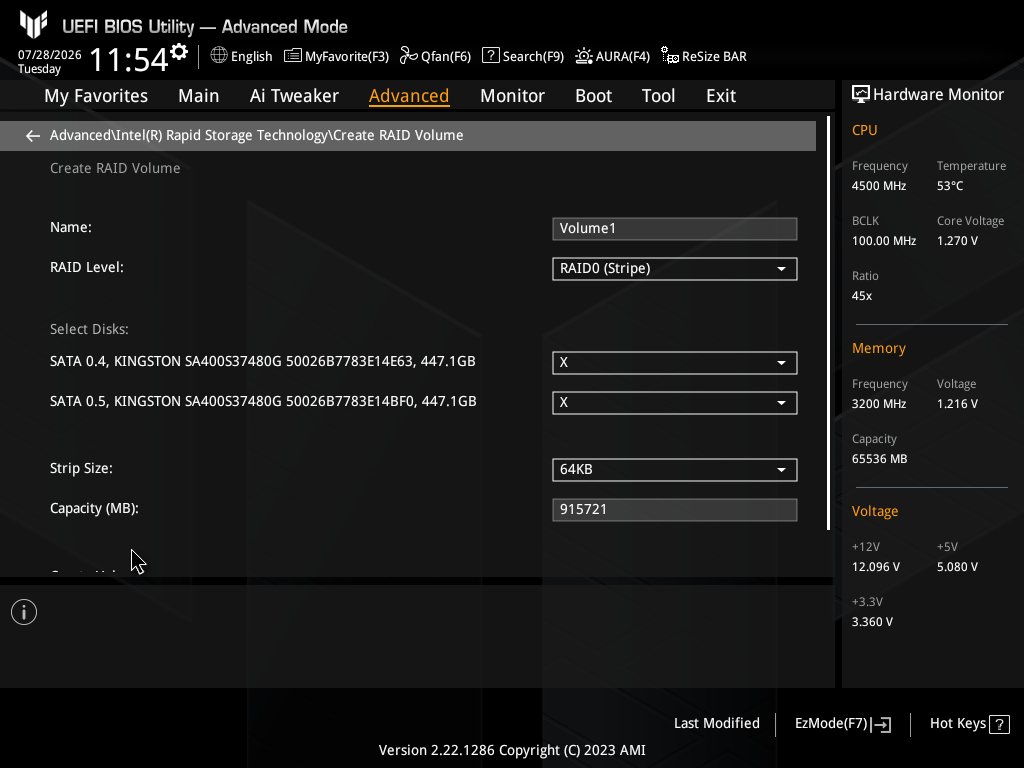
Intel motherboard RAID is handled by Intel Rapid Storage Technology (RST), which lives behind the VMD controller. To expose RST you enable VMD and map the SATA controller under it, then the "Intel(R) Rapid Storage Technology" item appears under the Advanced tab where you create the array.
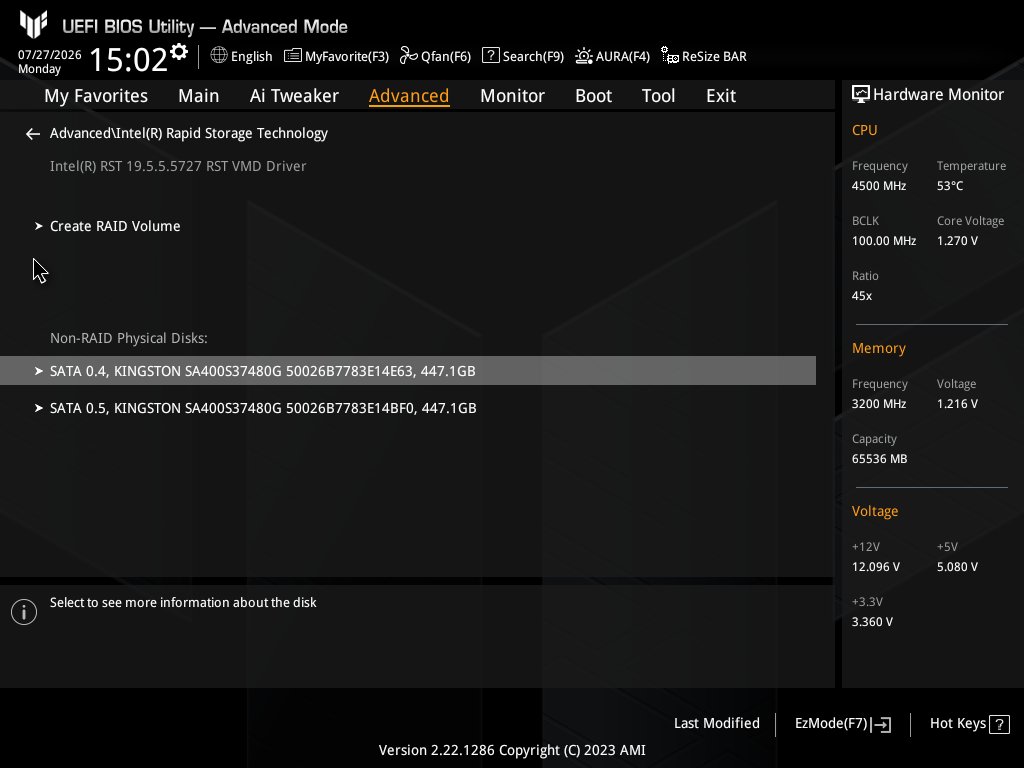
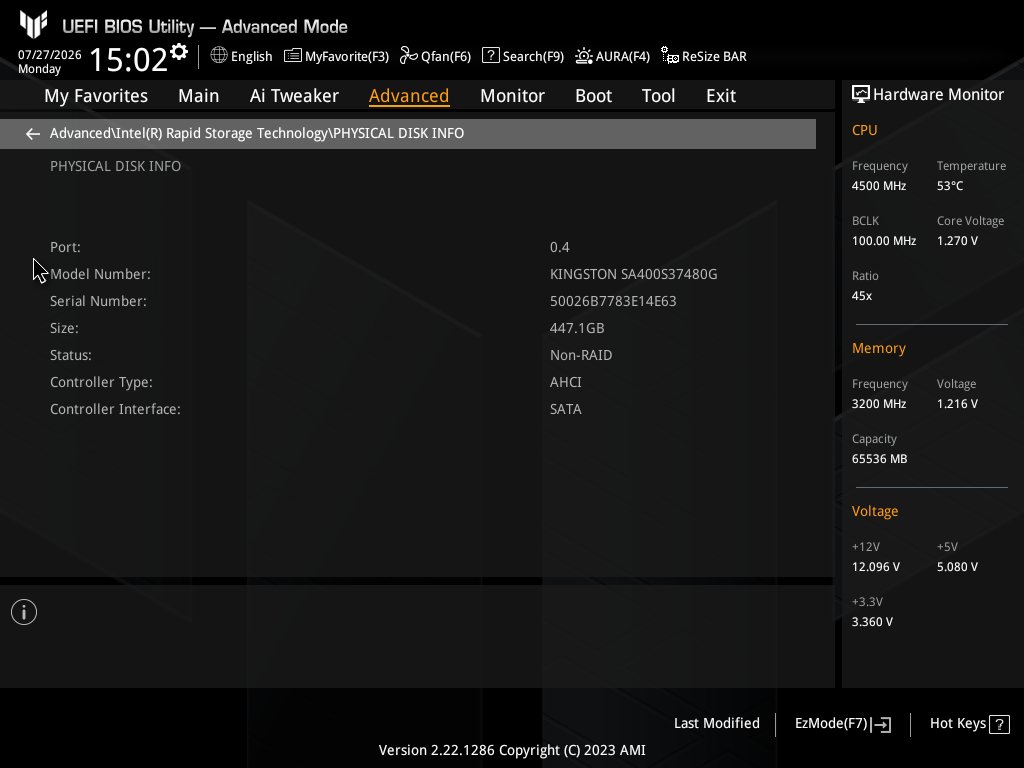
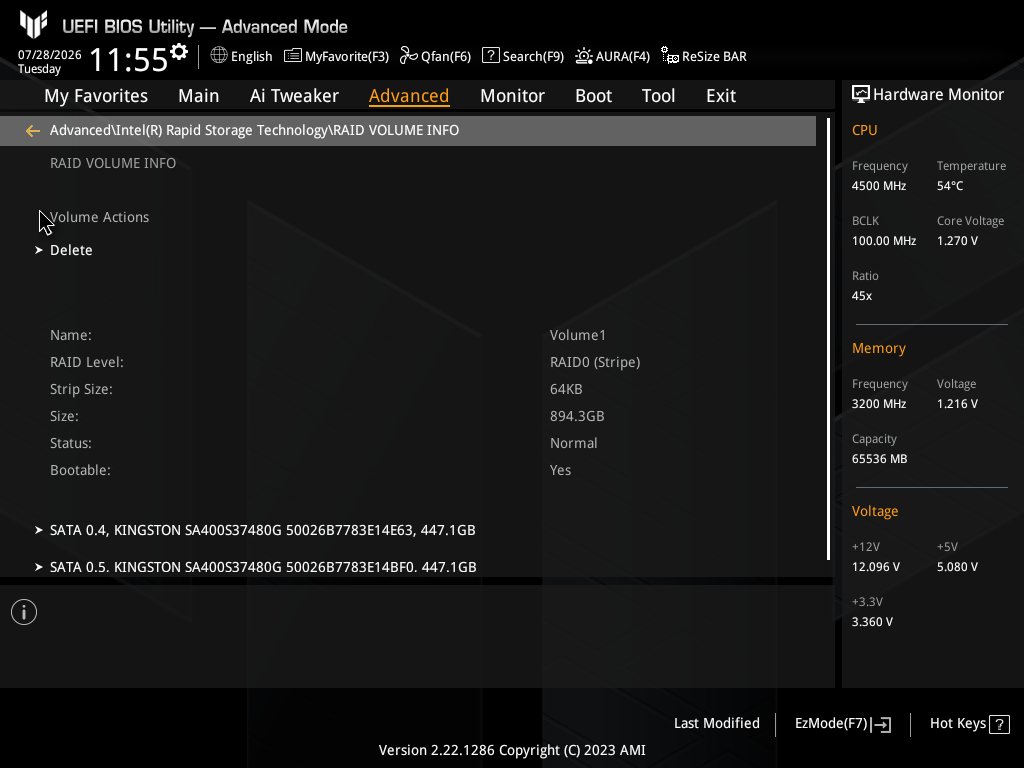
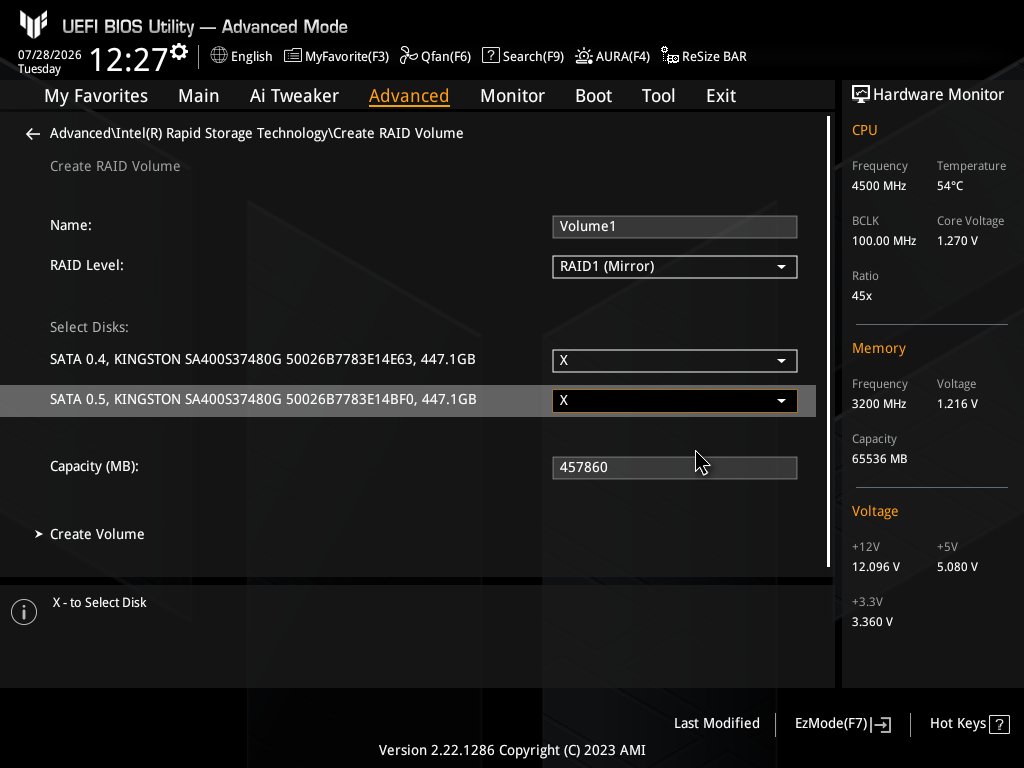
Creating the arrays. RAID 0 stripes across both disks for a combined 894.3 GB volume (64 KB stripe size). RAID 1 mirrors the two disks, so usable capacity stays at a single disk's 447.1 GB.
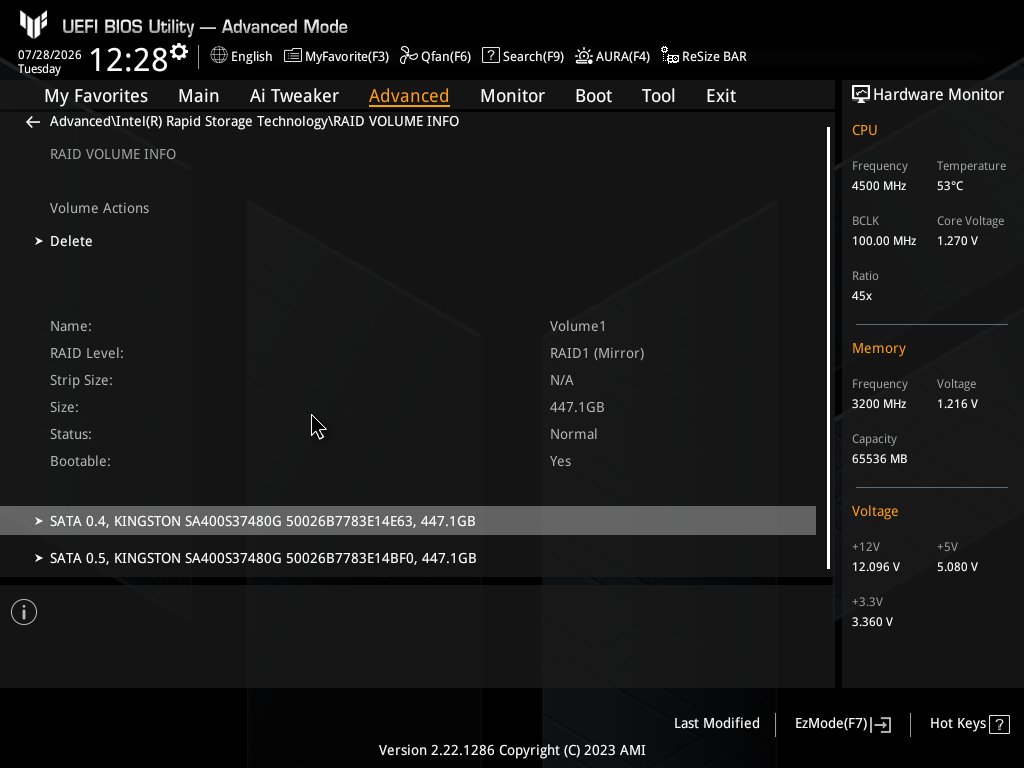
After the volume shows up in Windows I initialized and formatted it from an elevated command
prompt with diskpart. For Non-RAID I did each physical disk in turn (mounted as
E: and F:); for RAID 0 / RAID 1 the array appears as a single disk.
diskpart
  list disk
  select disk 1          * pick the target disk (verify the size first!)
  clean                  * wipes the disk - double-check the number
  convert gpt
  create partition primary
  format fs=ntfs quick label="SSD"
  assign letter=E
  exit
Note: clean destroys everything on the selected disk. Always confirm the
disk number with list disk against the reported capacity before running it.
RAID 0 (striping) splits data across both drives, so reads and writes can run in parallel. You get roughly double the capacity and, for large sequential work, close to double the throughput. The catch: there is no redundancy — if either drive fails, the whole array is lost. It's for speed and scratch space, not for data you can't lose.
RAID 1 (mirroring) writes the same data to both drives. Usable capacity is only one drive, and writes are gated by a single drive's speed, but reads can be served from both, and the array survives a single-drive failure. It's for availability, not raw speed — and it is not a backup substitute, since it happily mirrors accidental deletions too.
| Aspect | RAID 0 (Stripe) | RAID 1 (Mirror) |
|---|---|---|
| Usable capacity | Sum of both disks (~894 GB) | One disk (~447 GB) |
| Redundancy | None — 1 failure = total loss | Survives 1 disk failure |
| Read speed | Best (parallel) | Good (can read from both) |
| Write speed | Best (parallel) | ~single-disk |
| Best for | Speed, scratch, large files | Uptime / data availability |
Where RAID 0 makes sense — pick it when the data is reproducible and speed is everything:
Where RAID 1 makes sense — pick it when the box must keep running and the data matters:
Three configurations were measured with an identical test matrix modeled on CrystalDiskMark's defaults:
Each test used an 8 GB file (large enough to exceed the SSD cache), ran 30 seconds with a 5 second warmup, and used unbuffered + write-through I/O so the OS cache doesn't inflate results. For Non-RAID, the two drives (E: and F:) were measured separately; the numbers below are their average.
DiskSpd is Microsoft's command-line storage load generator (the engine behind many
Windows disk benchmarks). I wrapped it in
Run-DiskBenchmark.ps1,
which runs the whole test matrix, samples CPU/memory/disk utilization once per second during each
run, prints a summary, and appends everything to a timestamped CSV.
Execution environment. Run PowerShell as Administrator. If the script is blocked by execution policy, allow it for the current session only:
Set-ExecutionPolicy -Scope Process -ExecutionPolicy BypassThen run one config at a time:
# Non-RAID: measure both physical drives individually
.\Run-DiskBenchmark.ps1 -Drives E,F -Config NonRAID

# RAID 0 array (mounted here as E:)
.\Run-DiskBenchmark.ps1 -Drives E -Config RAID0

# RAID 1 array
.\Run-DiskBenchmark.ps1 -Drives E -Config RAID1
The six DiskSpd invocations behind each run map to the test cases above:
SEQ1M-Q8T1-Read     -b1M -o8  -t1  -w0
SEQ1M-Q8T1-Write    -b1M -o8  -t1  -w100
RND4K-Q32T16-Read   -b4K -o32 -t16 -w0   -r
RND4K-Q32T16-Write  -b4K -o32 -t16 -w100 -r
RND4K-Q1T1-Read     -b4K -o1  -t1  -w0   -r
RND4K-Q1T1-Write    -b4K -o1  -t1  -w100 -r
# common: -c8G -d30 -W5 -C1 -Sh -L   (8GB file, 30s, warmup/cooldown, no cache, latency)
Why "as Administrator" matters. Without elevation, DiskSpd cannot acquire the
SeManageVolumePrivilege and prints these warnings while preparing the test file:
WARNING: [DiskSpd] Error adjusting token privileges for SeManageVolumePrivilege (error code: 1300)
WARNING: [DiskSpd] Could not set privileges for setting valid file size; will use a slower method of preparing the file
This privilege lets DiskSpd set the test file's valid size instantly instead of zero-filling it. It only affects file-prep time, not the measured throughput/latency — but running elevated avoids the warnings and keeps runs consistent, and is required if you write the test file to a drive root.
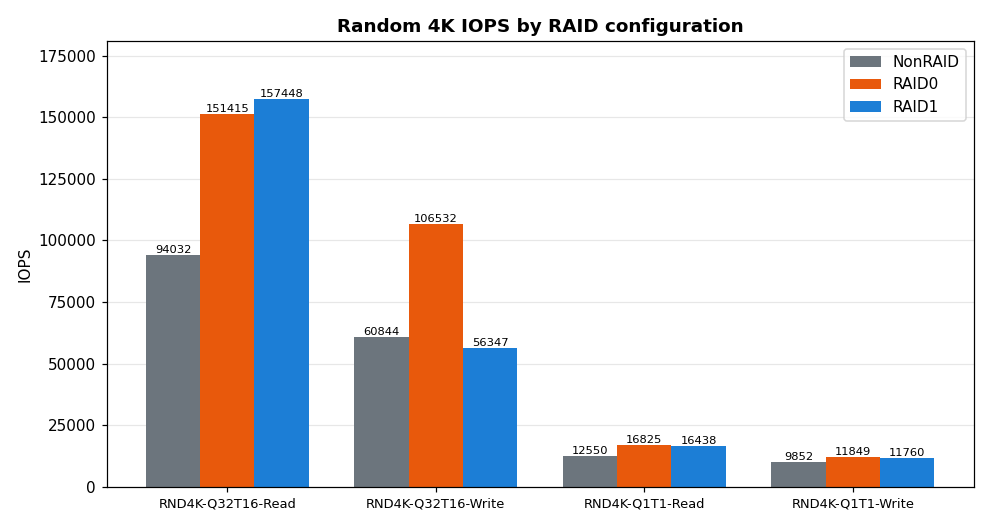
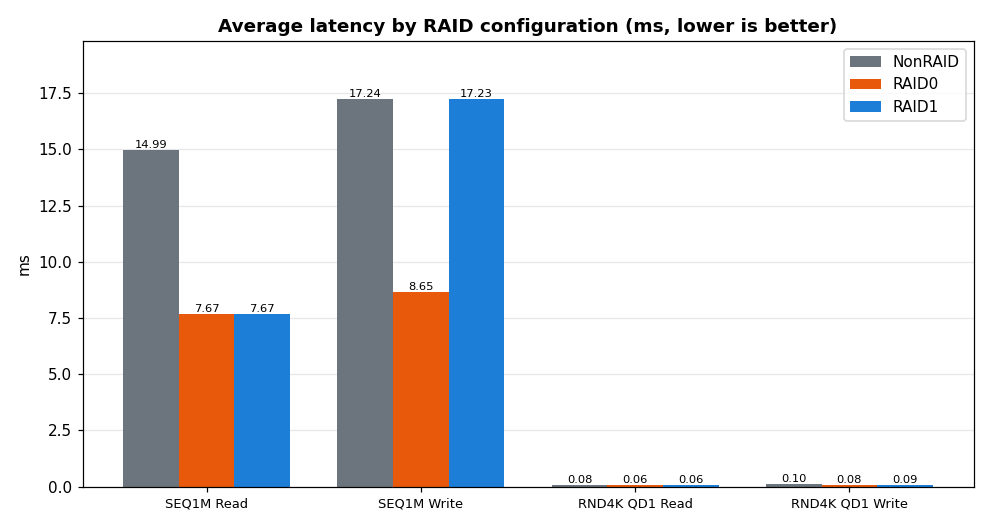
Numbers are DiskSpd's reported MB/s, IOPS and average latency. Non-RAID is the E:/F: average; RAID 0 and RAID 1 are the single array. The clear winner per row is highlighted.
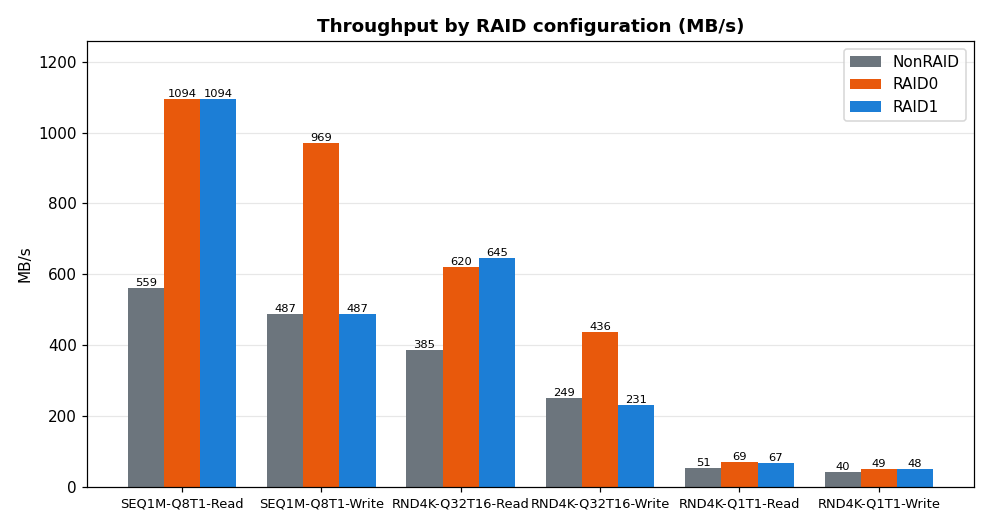
Sequential throughput (SEQ1M Q8T1)
| Test | Non-RAID | RAID 0 | RAID 1 |
|---|---|---|---|
| Read (MB/s) | 559 | 1094 | 1094 |
| Write (MB/s) | 487 | 969 | 487 |
Random 4K, high queue (RND4K Q32T16) — IOPS
| Test | Non-RAID | RAID 0 | RAID 1 |
|---|---|---|---|
| Read (IOPS) | 94,032 | 151,415 | 157,448 |
| Write (IOPS) | 60,845 | 106,532 | 56,347 |
Random 4K, QD1 responsiveness (RND4K Q1T1) — latency
| Test | Non-RAID | RAID 0 | RAID 1 |
|---|---|---|---|
| Read (ms) | 0.080 | 0.059 | 0.061 |
| Write (ms) | 0.103 | 0.084 | 0.085 |
The results line up almost exactly with the theory. RAID 0 nearly doubles both sequential read and write (559→1094 MB/s read, 487→969 MB/s write) and leads on random writes — the fast, no-safety-net option. RAID 1 matches RAID 0 on reads (it can pull from both mirrors) but its writes stay at single-disk speed and its random 4K writes actually dip below Non-RAID (~56k vs 61k IOPS) because every write must hit both drives. That's the mirror's write penalty, and it's the price of surviving a drive failure.
So the choice isn't "which is faster" but "what do you need": RAID 0 for throughput, RAID 1 for resilience, and plain single disks when you want neither the risk nor the overhead. And whichever you pick, RAID is never a replacement for backups.
A benchmark is only as good as its controls, so a few deliberate choices behind these numbers:
-Sh)
on an 8 GB file that exceeds the SSD/DRAM cache, so the results reflect the drives, not a
cache hit.Taken together, that's the point of the exercise: not just "RAID 0 is faster," but a repeatable way to measure how much faster, where, and at what trade-off — the same discipline you'd apply when validating storage or memory performance for real.