This is Part 2 of the SSD test series. In Part 1 I benchmarked two SATA SSDs on Windows 11 across Non-RAID, RAID 0 and RAID 1 using Microsoft DiskSpd. Here I run the same disks, same machine, same test matrix — but on Linux, inside Windows' WSL Ubuntu, using fio (the Linux counterpart of DiskSpd). The goal is a clean, apples-to-apples look at how the same storage behaves under a different OS, and what the numbers say when you put Windows and Linux side by side on identical hardware.
To keep this focused, I'm not repeating the hardware, BIOS/Intel-RST setup, RAID 0 vs RAID 1 theory, or the detailed test-case definitions — those are all in Part 1. This post covers only what's new for Linux: the disk preparation, the fio-based test tool, the Ubuntu results, and the cross-platform comparison.
The whole point of a series is that the runs are comparable, so the Linux side was built to match Part 1 exactly:
--direct=1 on Linux, mirroring DiskSpd's
-Sh on Windows).The only intentional variable is the OS/engine: Windows + DiskSpd vs. Linux + fio.
Because it's a VM with a real kernel, WSL 2 can attach a physical disk directly with
wsl --mount, so Ubuntu sees the real block devices rather than a Windows drive-letter
share. The catch: Windows holds an exclusive lock
on a disk it has online, so each disk must be taken offline in Windows first, then
bare-mounted into WSL and formatted as a native Linux filesystem (ext4).
Step 1 — In Windows (elevated PowerShell), take the disk(s) offline:
Get-Disk                              # find the target DiskNumber
Set-Disk -Number 1 -IsOffline $true   # release Windows' exclusive lock
Step 2 — Attach the raw disk(s) into WSL:
wsl --mount \\.\PHYSICALDRIVE1 --bare
wsl --mount \\.\PHYSICALDRIVE2 --bare
# --bare = expose as a raw block device; WSL does not auto-mount/format it
Step 3 — In Ubuntu, format as ext4 and mount:
lsblk                          # identify the new devices (e.g. /dev/sde, /dev/sdf)
sudo wipefs -a /dev/sde        # * DESTRUCTIVE: erases the existing partition table
sudo mkfs.ext4 /dev/sde        # whole-disk ext4
sudo mkdir -p /mnt/raid0test
sudo mount /dev/sde /mnt/raid0test
sudo chown $(whoami):$(whoami) /mnt/raid0test/mnt/e, but that path goes over the DrvFs (9P) translation
layer and measures that overhead, not the disk. To measure Linux filesystem performance honestly,
the disk must be a real ext4 volume. Note that reformatting to ext4 destroys the NTFS data
on that disk — do this only on disks you can wipe.
Step 4 — When finished, hand the disk back to Windows:
# in Ubuntu
sudo umount /mnt/raid0test
# in Windows
wsl --unmount \\.\PHYSICALDRIVE1
Set-Disk -Number 1 -IsOffline $false   # back online (reformat to NTFS to reuse)
The full step-by-step, including the Non-RAID two-disk case, is in
Windows_WSL_Ubuntu_Disk_Preparation.txt in the repo.
The Linux tool is run-disk-benchmark.sh, the direct counterpart of Part 1's
Run-DiskBenchmark.ps1. It swaps the engine from DiskSpd to fio but runs
the same 6-test matrix, samples CPU/memory/disk utilization once per second during each run (from
/proc), and writes a timestamped CSV with the identical column layout. Both scripts live
in one repo: github.com/devdama/disk-benchmark.
Setup and run:
sudo apt install fio jq          # fio = engine, jq = parse fio's JSON output

# Non-RAID: measure the two mount points individually
./run-disk-benchmark.sh --targets /mnt/nonraid1,/mnt/nonraid2 --config NonRAID

# RAID 0 / RAID 1 arrays (single mount point)
./run-disk-benchmark.sh --targets /mnt/raid0test --config RAID0
./run-disk-benchmark.sh --targets /mnt/raid1test --config RAID1
The six fio jobs map one-to-one onto the DiskSpd tests from Part 1:
SEQ1M-Q8T1-Read     --rw=read      --bs=1M --iodepth=8  --numjobs=1
SEQ1M-Q8T1-Write    --rw=write     --bs=1M --iodepth=8  --numjobs=1
RND4K-Q32T16-Read   --rw=randread  --bs=4k --iodepth=32 --numjobs=16
RND4K-Q32T16-Write  --rw=randwrite --bs=4k --iodepth=32 --numjobs=16
RND4K-Q1T1-Read     --rw=randread  --bs=4k --iodepth=1  --numjobs=1
RND4K-Q1T1-Write    --rw=randwrite --bs=4k --iodepth=1  --numjobs=1
# common: --direct=1 --ioengine=libaio --size=8G --runtime=30 --ramp_time=5 --time_based=1
--direct=1 bypasses the Linux page cache (the equivalent of DiskSpd's -Sh),
and --ioengine=libaio issues asynchronous I/O so --iodepth is actually
meaningful. Root isn't required for cache bypass, but running with sudo avoids
permission issues on the mount points.
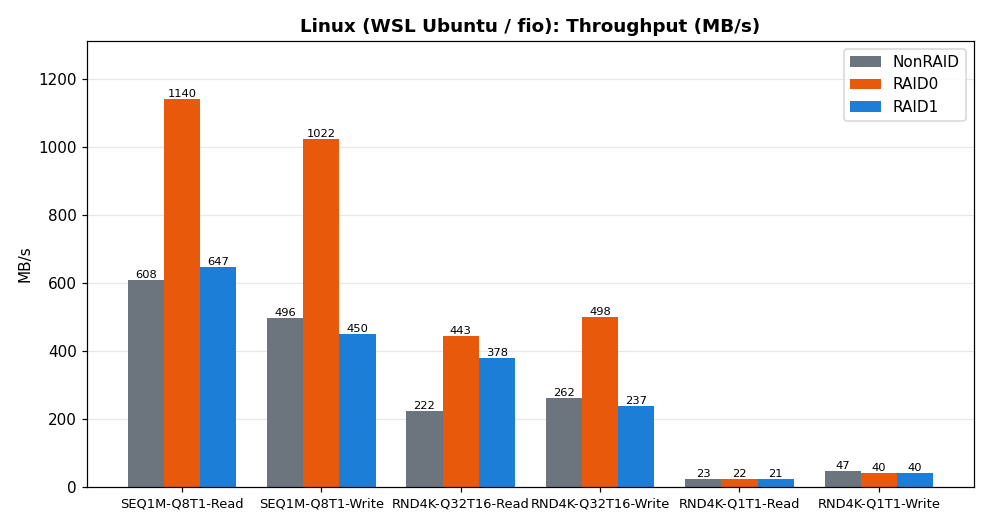
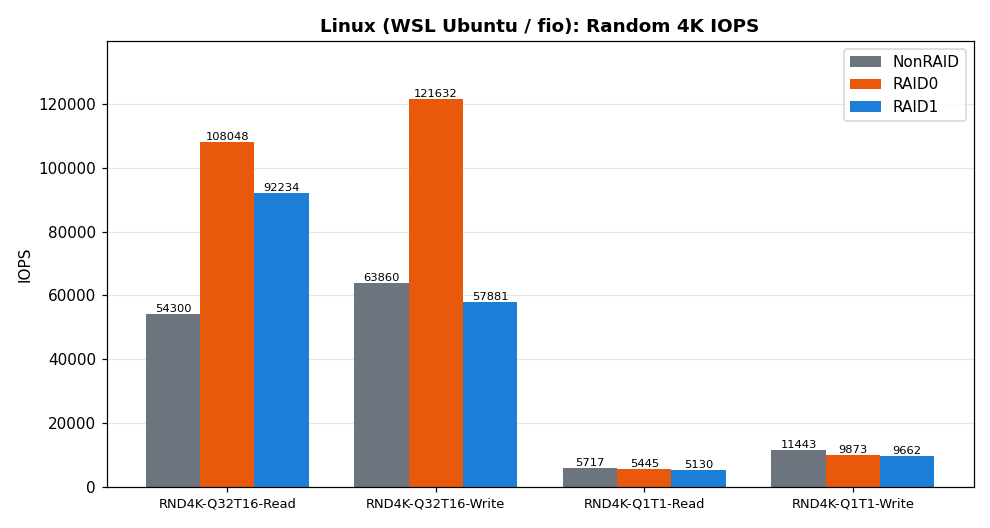
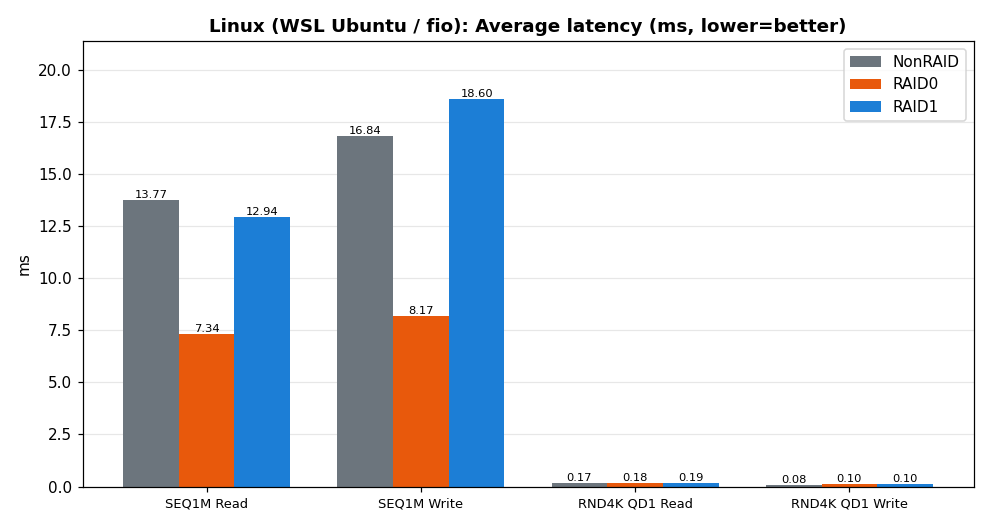
Numbers are fio's reported MB/s, IOPS and average latency. Non-RAID is the average of the two mount points; RAID 0 and RAID 1 are the single array. As in Part 1, each chart uses the metric that matters for that workload (throughput for all six tests; IOPS for the random tests; latency for the responsiveness-sensitive cases), and the full tables below carry every number.
Sequential throughput (SEQ1M Q8T1)
| Test | Non-RAID | RAID 0 | RAID 1 |
|---|---|---|---|
| Read (MB/s) | 608 | 1140 | 647 |
| Write (MB/s) | 496 | 1022 | 450 |
Random 4K, high queue (RND4K Q32T16) — IOPS
| Test | Non-RAID | RAID 0 | RAID 1 |
|---|---|---|---|
| Read (IOPS) | 54,300 | 108,048 | 92,234 |
| Write (IOPS) | 63,860 | 121,632 | 57,881 |
Random 4K, QD1 responsiveness (RND4K Q1T1) — latency
| Test | Non-RAID | RAID 0 | RAID 1 |
|---|---|---|---|
| Read (ms) | 0.171 | 0.180 | 0.192 |
| Write (ms) | 0.085 | 0.097 | 0.100 |
Here's the interesting part: identical disks and arrays, measured on each OS. The picture is mixed — neither platform wins everywhere.
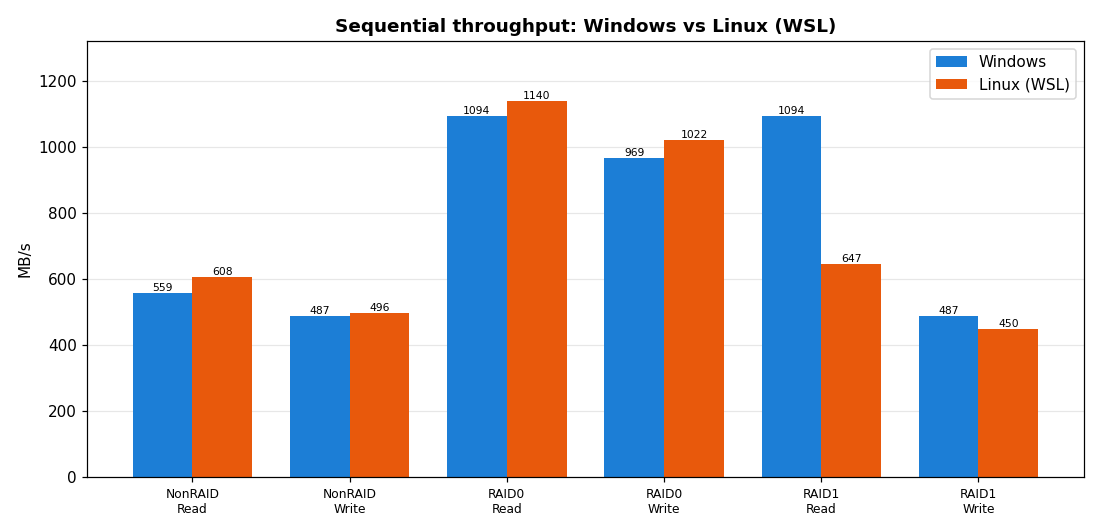
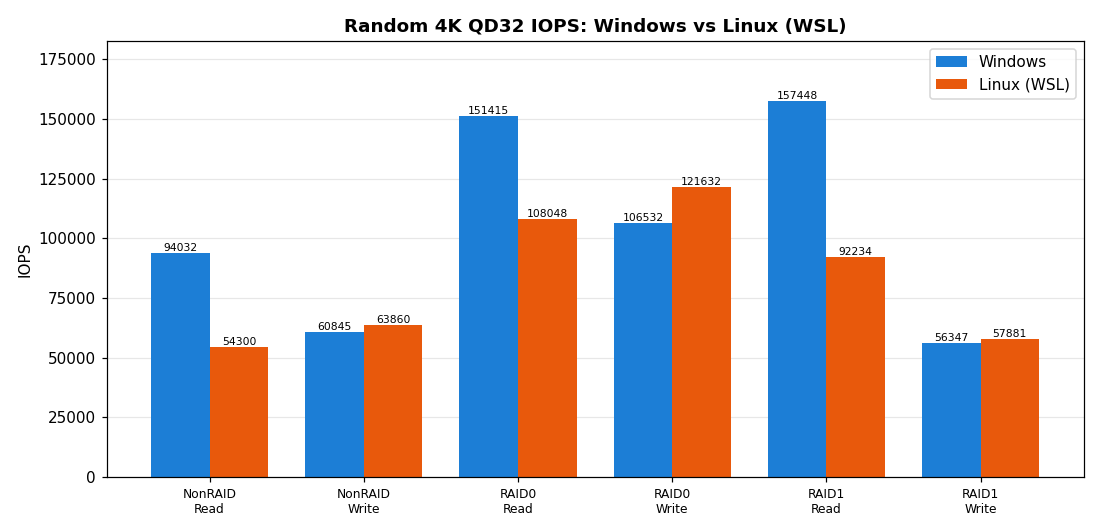
Two patterns stand out:
The RAID story is the same on both platforms, which is reassuring: RAID 0 roughly doubles sequential throughput and leads random I/O, while RAID 1 matches single-disk writes and pays a small random-write penalty for its redundancy. On top of that, the OS layer clearly matters: on this machine Linux/fio was a touch faster for sequential streaming, while Windows/DiskSpd reported markedly higher high-queue random reads — with the caveat that the Linux numbers carry WSL 2 virtualization overhead. The practical lesson is that a benchmark measures hardware + OS + engine together, so cross-platform numbers are only meaningful when, as here, every other variable is pinned down.
Next in the series: a native (bare-metal) Linux run to isolate how much of the gap above is really WSL, plus a planned macOS script.